PJM's demand forecast and generation queue run on different clocks
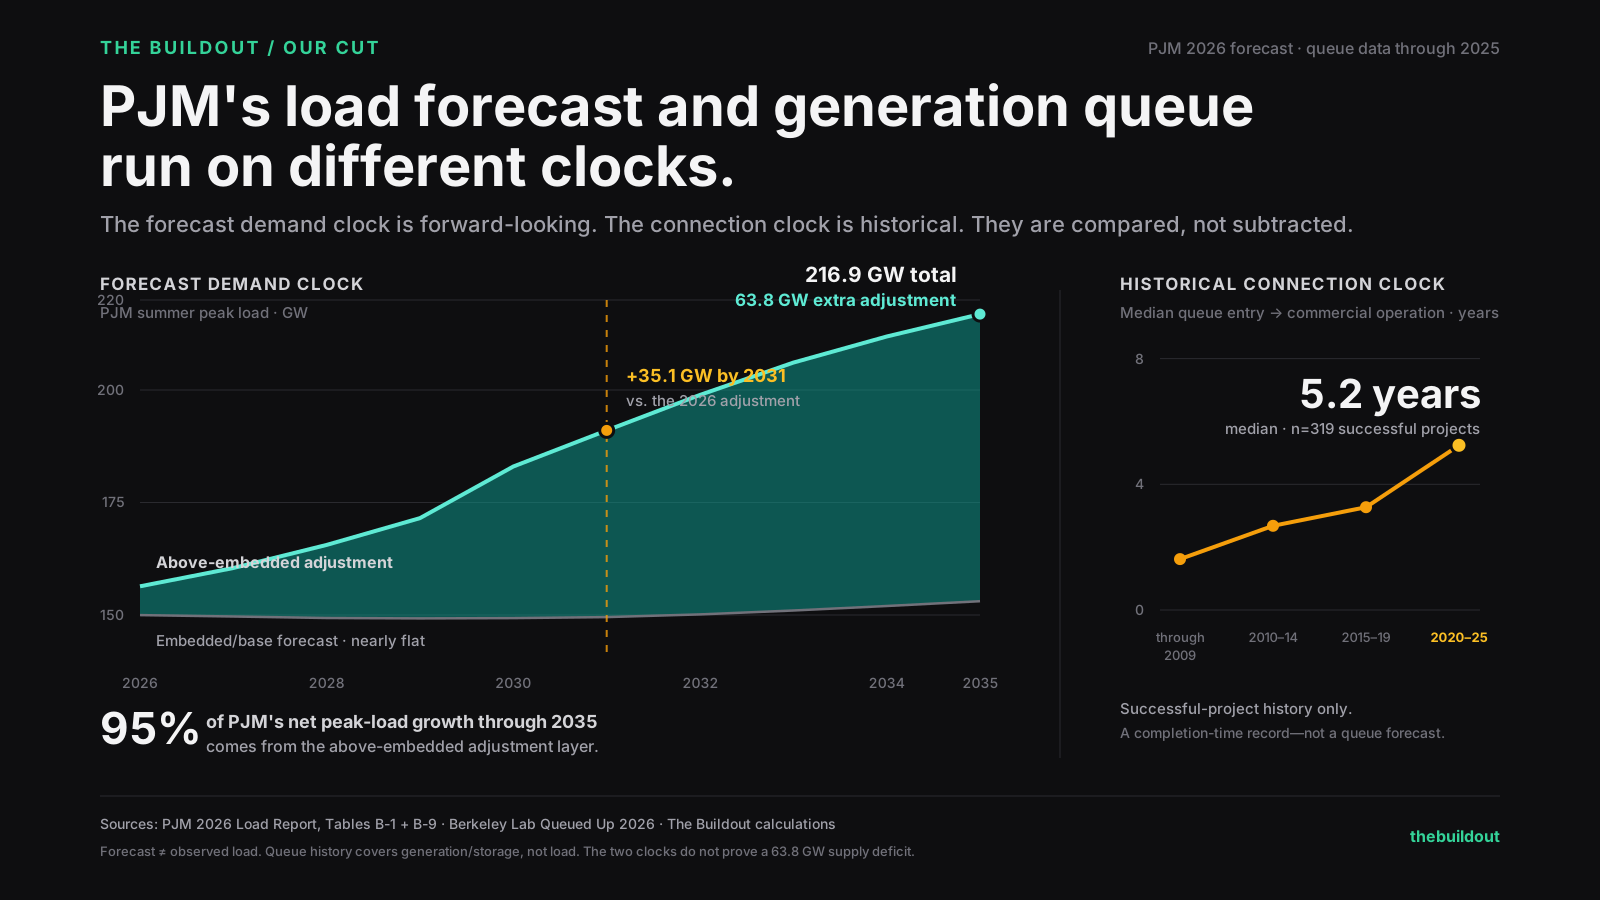
PJM's 2026 forecast puts 95% of peak-load growth through 2035 in an adjustment layer, while successful generation projects reached operation in a median 5.2 years.
Swipe sideways to inspect the full graph.
PJM's next decade is not a normal load-growth story. Its 2026 summer-peak forecast rises from 156.4 GW in 2026 to 216.9 GW in 2035. But almost all of that increase sits outside the embedded forecast: the separately reported above-embedded adjustment grows from 6.4 GW to 63.8 GW. That layer contributes 57.4 GW of the 60.5 GW net increase, or 94.9%.
PJM says most of these adjustments reflect data-center growth. That does not make every megawatt an AI load: the table also contains smaller items such as voltage optimization, port electrification, and peak shaving in individual zones. We therefore label the measure exactly as PJM does—above-embedded adjustment—instead of relabeling it AI demand.
That is the demand clock. The connection clock comes from Berkeley Lab's 2026 Queued Up dataset. Among 319 successful PJM generation projects completed from 2020 through 2025 with valid queue and online dates, the median trip from queue entry to commercial operation was 5.24 years. Across all reported terminal PJM queue records, operational projects contain 97.6 GW and withdrawn projects contain 638.1 GW, an observed operational share of 13.3% of terminal megawatts.
These numbers belong beside each other, but not inside one subtraction. PJM's load forecast is forward-looking demand measured in peak megawatts. Berkeley Lab's queue history is backward-looking interconnection-request records with capacity and timing fields. The comparison shows two systems moving on different clocks; it does not prove a 63.8 GW supply deficit or convert the historical outcome mix into a completion probability.
The central uncertainty is now explicit. The above-embedded adjustment is not a synonym for AI load, and only the 2026 forecast edition is normalized. The next useful evidence is not another headline: it is a revised forecast vintage, project-level large-load connection milestones, or a new generation completion cohort that changes either clock.
Sources and method
- PJM — 2026 Load Report tables — Tables B-1 and B-9, summer-peak forecast and adjustments above embedded load
- Berkeley Lab — Queued Up 2026 — Project-level interconnection queue records through 2025